Hack More. Report Less.
Fix what you find every time
Without the right tools and processes in place, test planning and report creation can be a manual nightmare, taking pentesters’ focus away from hacking. But it doesn’t have to be that way.
Dan DeCloss, founder and CTO at PlexTrac, recently spoke at SANS Hackfest 2023 on automated pentest reporting and ways to use it to elevate efficiency and impact.
Check out the recording of the webinar or keep reading for an overview of the discussion.

Overview of PlexTrac
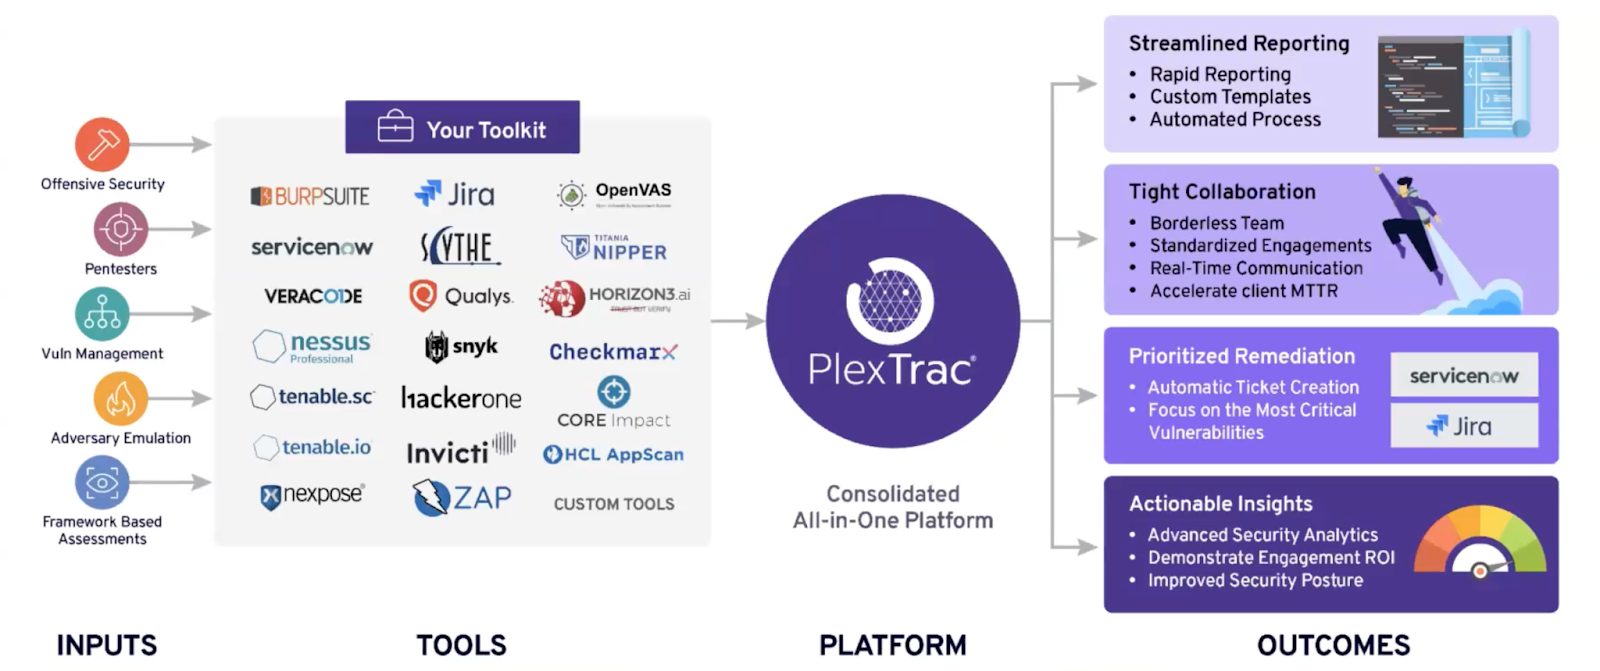
PlexTrac is the premier platform for automating pentest planning, reporting, and findings delivery. PlexTrac supports all of the front end use cases related to assessments (both offensive security assessments and pentesting assessments). We integrate with a lot of commonly used vendors to bring in data from your other systems and tools (like Snyk, Qualys, Veracode, etc.), giving you a single source of truth. We also have a content library which enables you to reuse types of findings and even the narrative sections.
Findings can be sent to different areas of your organization, or stakeholders’ organization, to address remediation. You can use PlexTrac to track fixes, send tickets via tools like Jira, and leverage the analytics.
Using your PlexTrac dashboard, you can see what you’ve been working on, what needs to be fixed or QA’d, etc.

Since PlexTrac was designed to meet the needs of both service providers and enterprise teams, labels can be changed in your dashboard to align with your team setup. For example, if you’re a service provider, you can label your reports by client. If you’re part of an enterprise, you can label your reports by department.
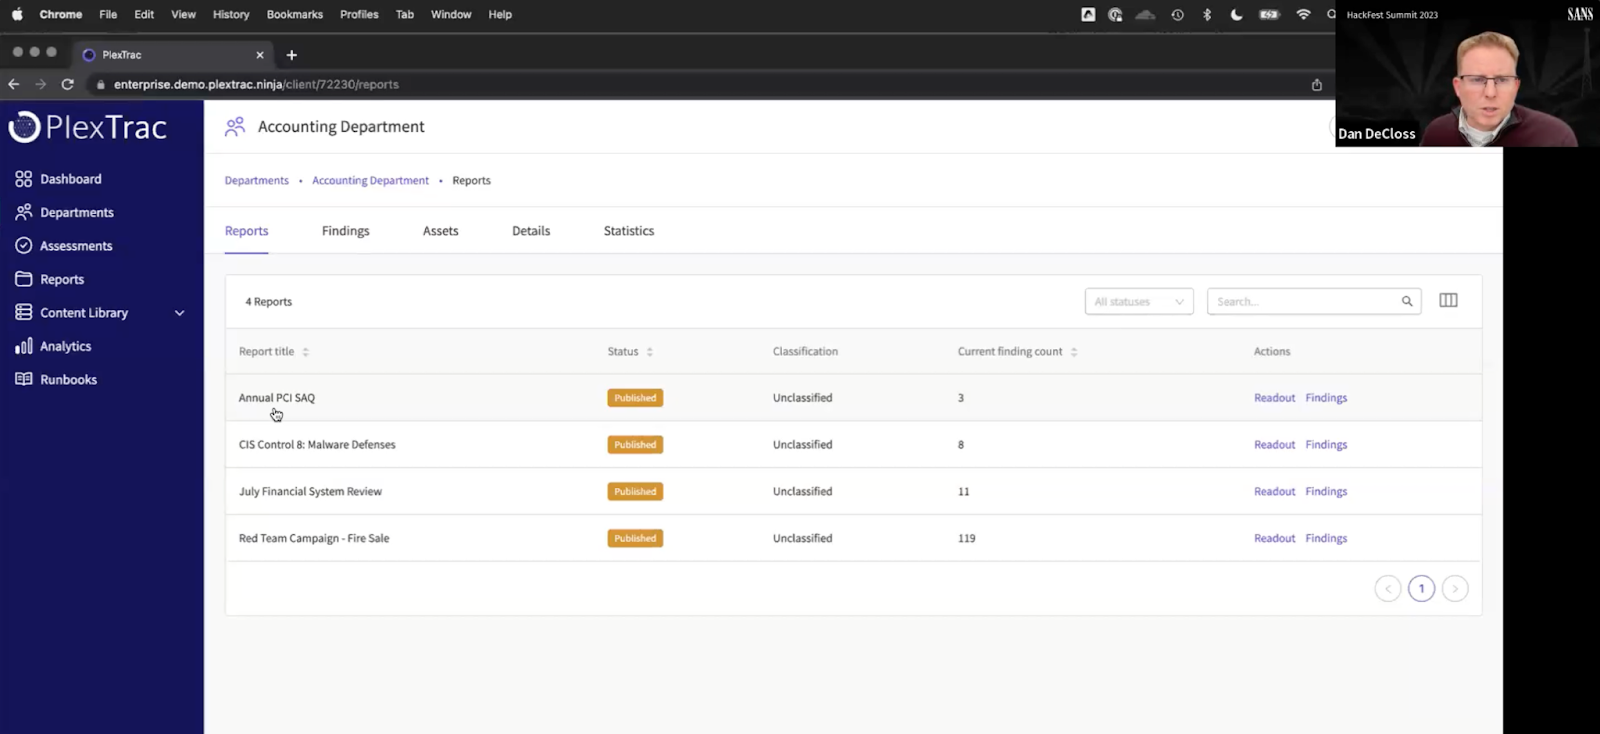
The platform has robust access control, so you can limit who has access to different departments or client reports. Data doesn’t carry over between clients or departments.
Creating Reports With PlexTrac
One of the main advantages of PlexTrac is being able to have reusable content, not just from a findings perspective, but narratives from reports. You can edit fields, add sections, etc.
If you’re collaborating with others, you can track your changes as you edit or leverage our “comments” feature. You can do this throughout every text field, which is very beneficial for quality assurance (QA).
Another important aspect is managing the findings. We support a lot of metadata around the findings, easy ways to tag relevant folks/findings/etc., criticality ratings, timelines needed for fixes, etc. It’s also easy to upload videos and photos to add additional context around findings.
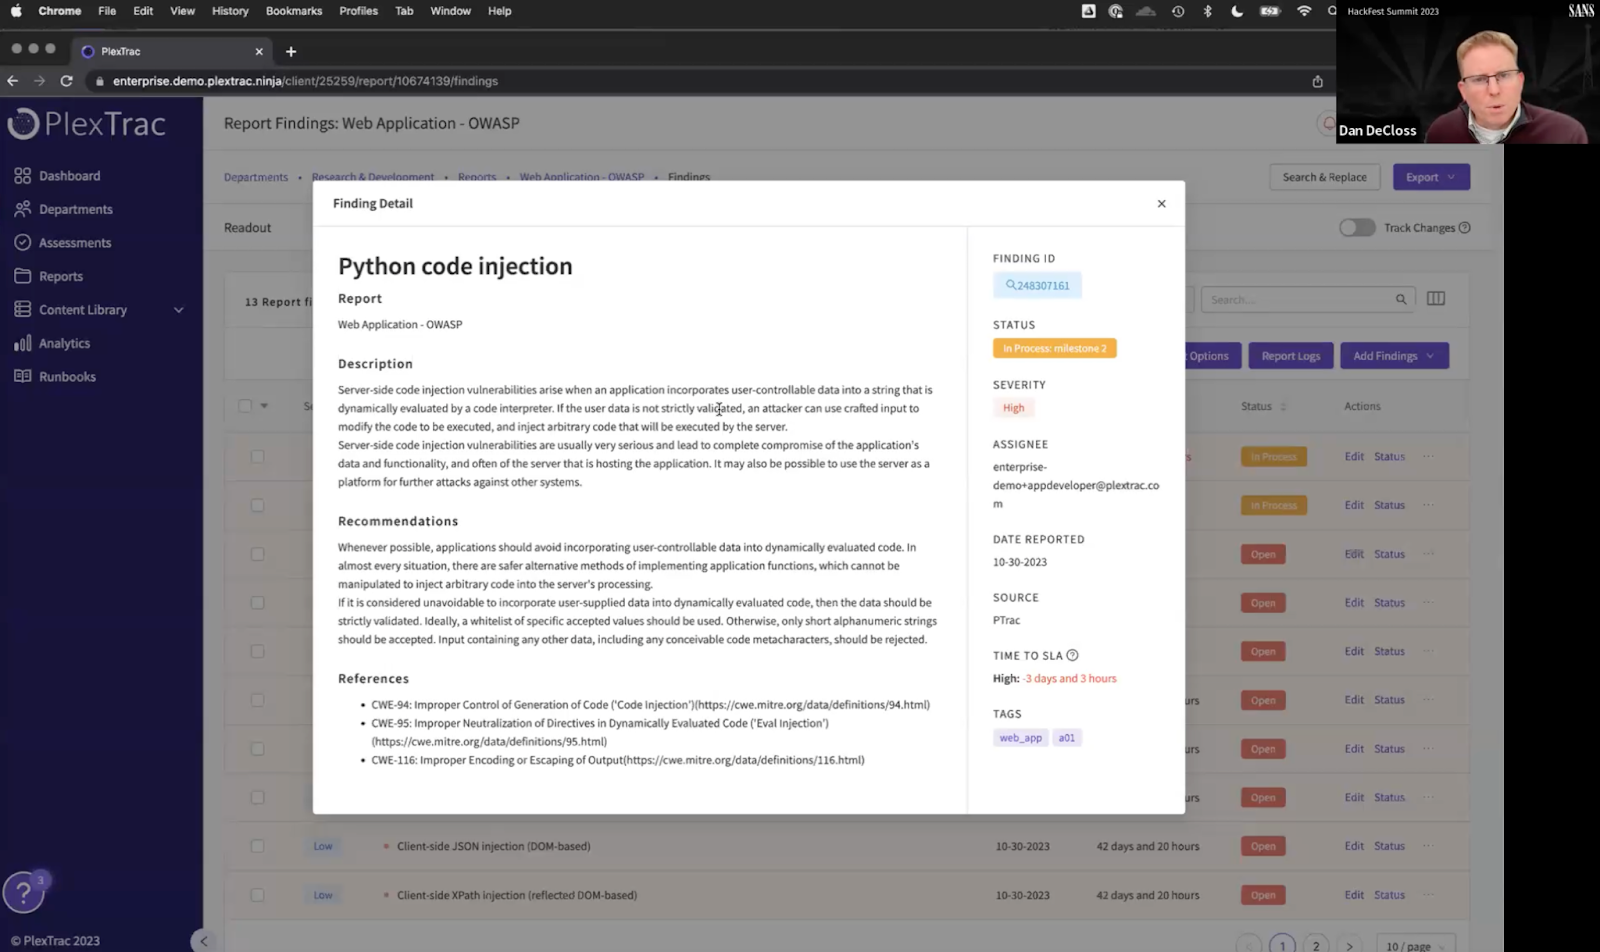
In terms of editing findings, you can tag them as open, closed, or in progress. You can also add sub statuses and create your own workflows.
Once you’re done with the finding, you can save it as “draft” or “published.” Best of all, findings can be worked on even while you’re still working on the report. So if you tag someone for a fix, they can start right away.
Formatting
We support full customization and enable you to export into Microsoft Word documents. If you would like to stick with the format we provide, you can. That said, you can easily customize it exactly how you want.
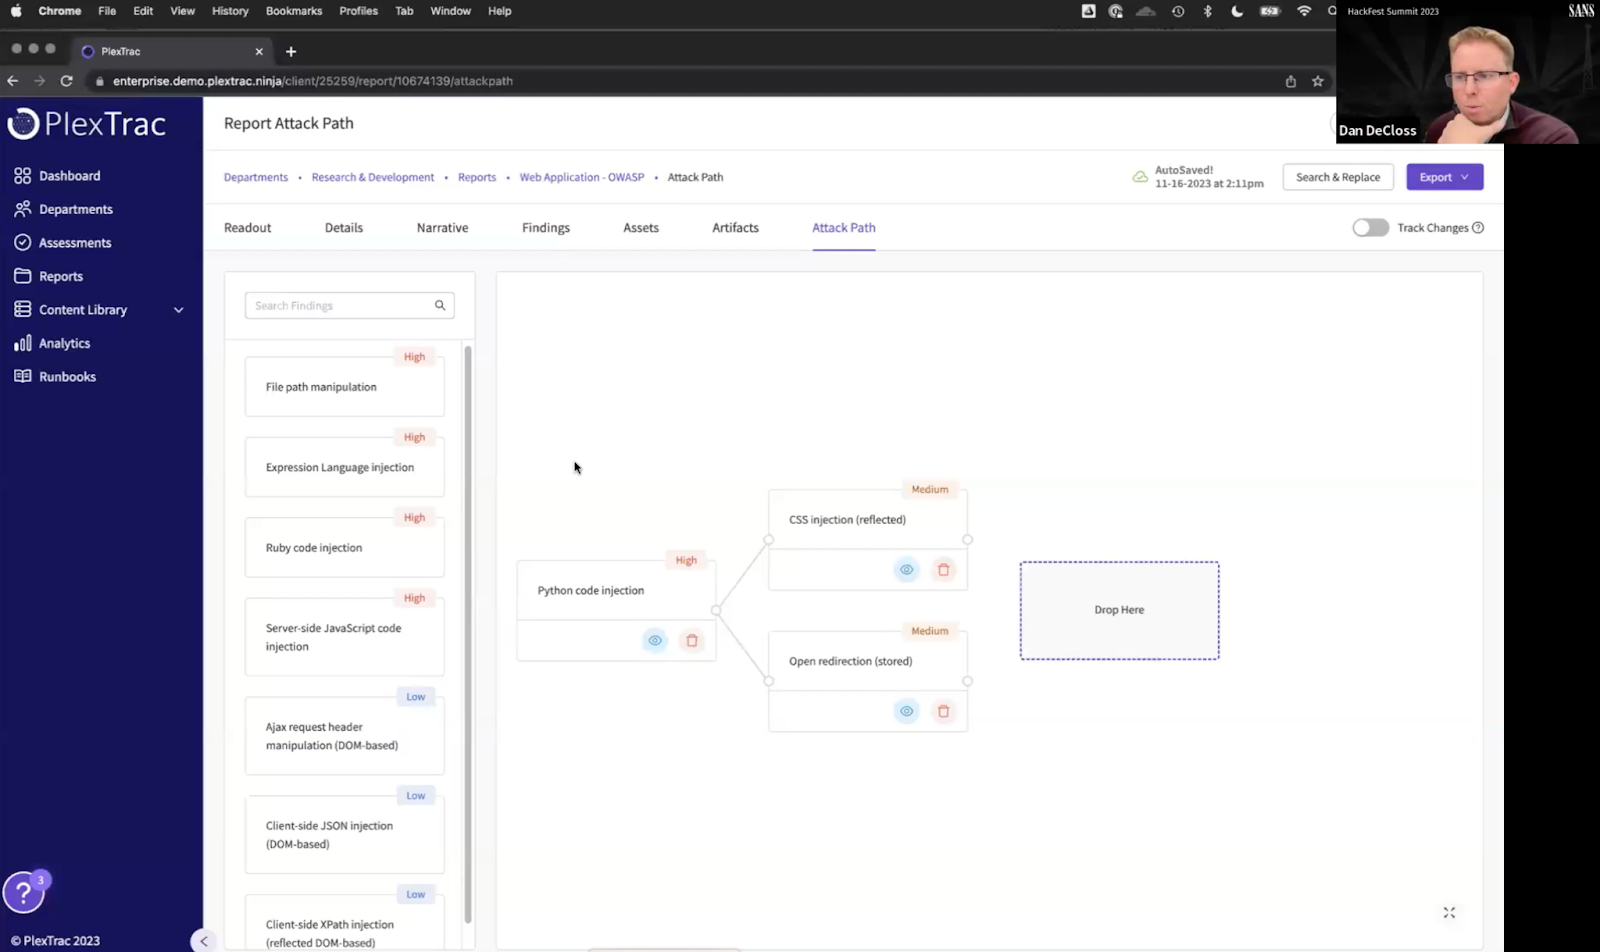
We have a feature called the “attack path” where you can drag and drop findings into different locations and specify the attack path.
Rapid creation of reports
Creating reports is fast and simple. You can set templates to get you started. When you select a template, it pulls in the standard narratives. If you want to bring in additional sections not typically in the template, you can. NarativesDB is a quick way to pull additional content or you can create a section from scratch.

Once you move on from the narratives section and go to the findings section, you can create a finding from the standard form, or – if it’s a finding you’ve discovered before – you can bring in that info. It’s very simple to pull in pre-built content, screenshots, videos, etc.
We also support the ability to pull from other sources and tag the owner of the fix using Jira.
Analytics
You can easily look into the analytics for each customer or department. It helps you see what’s still open, what’s closed, etc.

You can also drill into trends and service level agreements (SLAs). For example, you might want to know the mean time to fix a flaw based on severity or areas that aren’t improving.
For SLAs, you can set and change them as you see fit, and track them based on trends.
Runbooks
Runbooks supports the ability to run true purple team collaborative engagements where the red and blue team work on the same engagement. Runbooks also support table top exercises as well as a test methodology.
Interested in Learning More?
PlexTrac was designed to help pentesters hack more and report less. The average customer cuts reporting time by 50%. We’d love to show you what PlexTrac can do for you.